Notice: Function WP_Scripts::localize was called incorrectly. The $l10n parameter must be an array. To pass arbitrary data to scripts, use the wp_add_inline_script() function instead. Weitere Informationen: Debugging in WordPress (engl.) (Diese Meldung wurde in Version 5.7.0 hinzugefügt.) in /var/www/orchestra-staging/wp-includes/functions.php on line 5905

Notice: Function WP_Scripts::localize was called incorrectly. The $l10n parameter must be an array. To pass arbitrary data to scripts, use the wp_add_inline_script() function instead. Weitere Informationen: Debugging in WordPress (engl.) (Diese Meldung wurde in Version 5.7.0 hinzugefügt.) in /var/www/orchestra-staging/wp-includes/functions.php on line 5905

Notice: Function WP_Scripts::localize was called incorrectly. The $l10n parameter must be an array. To pass arbitrary data to scripts, use the wp_add_inline_script() function instead. Weitere Informationen: Debugging in WordPress (engl.) (Diese Meldung wurde in Version 5.7.0 hinzugefügt.) in /var/www/orchestra-staging/wp-includes/functions.php on line 5905

Notice: Function WP_Scripts::localize was called incorrectly. The $l10n parameter must be an array. To pass arbitrary data to scripts, use the wp_add_inline_script() function instead. Weitere Informationen: Debugging in WordPress (engl.) (Diese Meldung wurde in Version 5.7.0 hinzugefügt.) in /var/www/orchestra-staging/wp-includes/functions.php on line 5905
Cohort statistics - ORCHESTRA Cohort

Cohort documentation of WP2

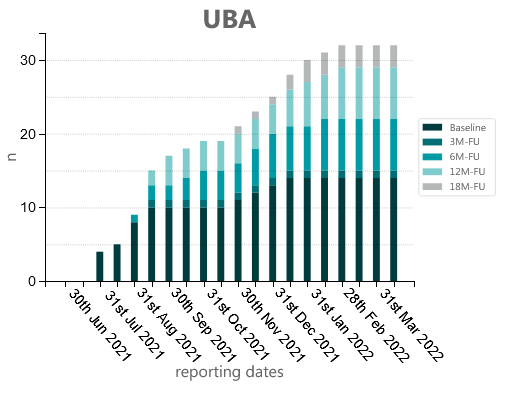
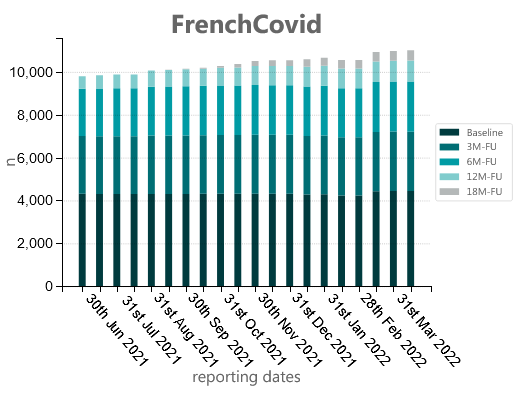
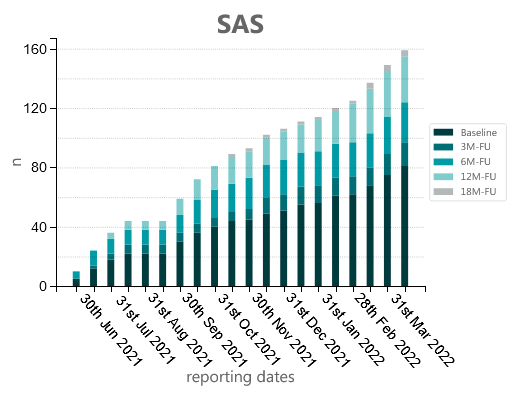
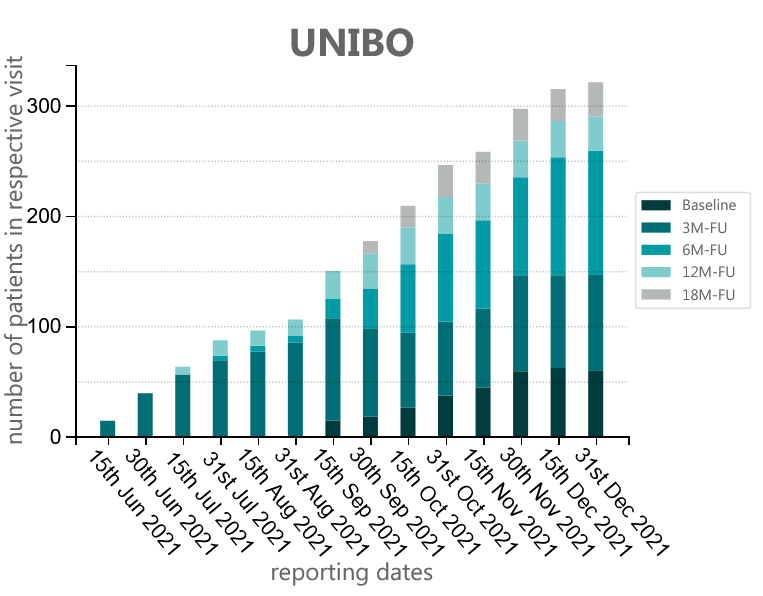
When analysing the following charts please consider the following:

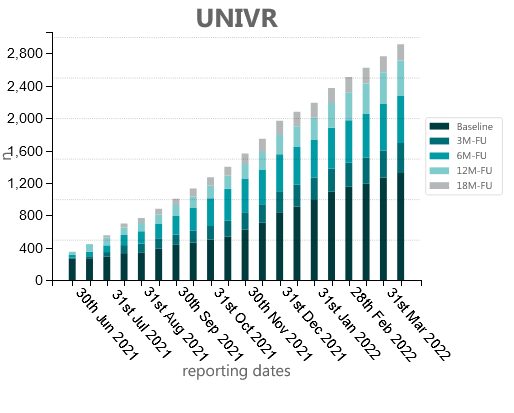
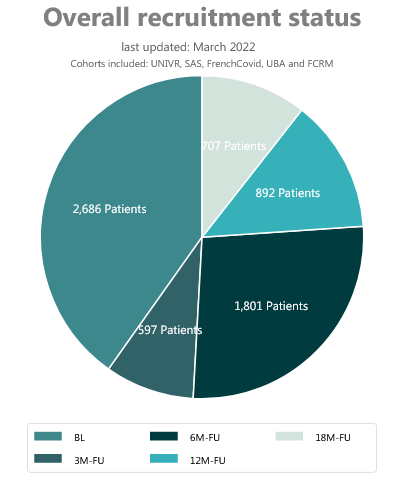
  1. Sometimes, the amount of patients might decrease. This relates to patients who have either withdrawn their consent or are lost to follow up.

  2. Most patients do not "go" through the follow up visits step by step, starting with 3 month follow-up, then 6 month follow up etc. as you would expect. ORCHESTRA consists of many heterogeneous cohorts with partly different visit structures. Recruitment can be challenging due to different circumstances, which can cause differences in visit timing.

  3. Note that some cohorts have just started collecting patient information, while others have been collecting data since the beginning of the pandemic.

BL = baseline visit, 3M-FU = 3 month follow up visit, 6M-FU = 6 month follow up visit, 12M-FU = 12 month follow up visit, 18M-FU = 18 month follow up visit

pie chart visualization of the overall patient recruitment status of WP2

WP2 - cohorts

n = amount of patients in the respective visit

stacked bar chart visualization of the patient recruitment status of cohort COVID-HOME
stacked bar chart visualization of the patient recruitment status of cohort FrenchCovid
stacked bar chart visualization of the patient recruitment status of cohort SAS
stacked bar chart visualization of the patient recruitment status of cohort UBA
stacked bar chart visualization of the patient recruitment status of cohort UNIBO
stacked bar chart visualization of the patient recruitment status of cohort UNIVR